
Track your Data and Make Wise Business Decisions
Google Analytics is an essential tool that provides you a wealth of information regarding your website as well as providing valuable insight into your users. Having a strong understanding of Google Analytics and its conversion measurement capabilities can be crucial in determining your contents effectiveness and the impact on your company’s bottom line. By knowing how to examine the right data, you can get an in-depth snapshot of how your site is performing and what needs tweaking.
While Google Analytics is a powerful tool, it can also be an overwhelming amount of information and data to process, even for the most experienced marketers. In order to fine-tune your efforts and get your website running at its peak, you need to know which specific reports to zero in on.
So let’s get down to the nitty gritty: these are the 5 essential Google Analytic reports marketers should use to gain better insight into a websites marketing performance.
- Audience Reports
- Traffic Acquisition Report
- E-commerce Tracking Report
- All Pages Report
- AdWords Report

1. Audience Report
The importance of understanding the demographics, behaviors and interests of your website visitors is immense. Having access to this knowledge can vastly help you improve your online marketing performance. That’s where the Google Analytics Audience Report comes in as it collects data on users that you can then group together based on any combination of attributes that is meaningful to your business.
Now there are nine separate reporting sections under Audience in your website’s Google Analytics profile. Below is a brief description of what data you’ll find in each reporting section.
Overview - A top-level view of user metrics.
Demographics - The age and gender makeup of your website audience.
Interests - User behaviors segmented by affinity and marketing categories.
Geo - The languages and locations of your website audience.
Behavior - Comparisons of new and returning visitors.
Technology - The browsers, operating systems and networks of your website visitors.
Mobile - A breakdown of devices used to access your website.
Custom - Reports you define.
Users Flow - A visualization of how users move through your website.
With the exception of Overview and Users Flow, each section provides an easy-to-read sessions graph and table chart showing the acquisition, behavior and conversions data for each group. Once you define an audience, you can then activate that audience on platforms like Google AdWords so you can explore your users behavior and focus your marketing efforts in response to that.
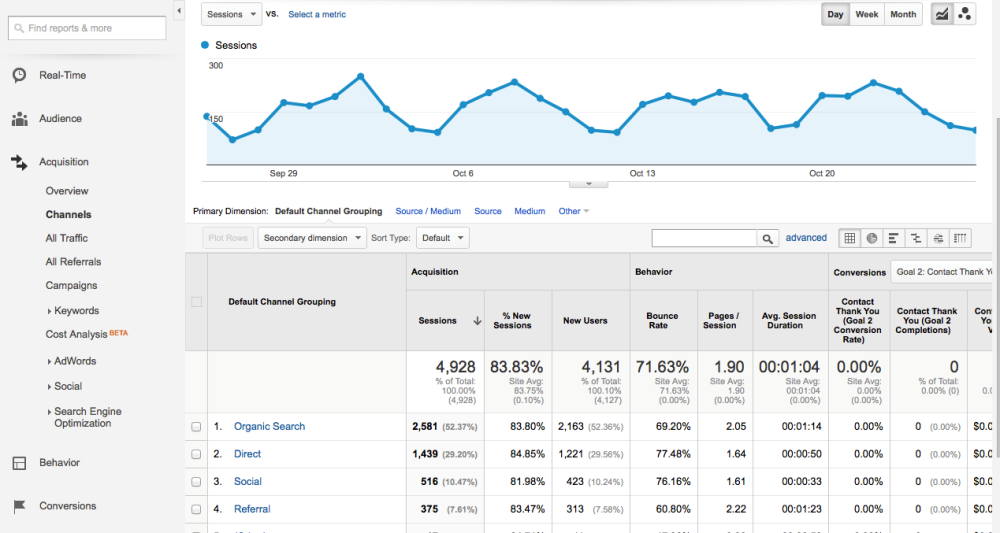
2. Traffic Channels Report
Are you wanting to know if people are actually clicking on your ads? How about if that blog post you published earlier, is it generating any traffic to your website? Or maybe you just want to know if your SEO strategy is working. The Traffic Acquisition Report will tell you all this and more. For many marketers, this will be their first step in the reporting process and one of the most important reports to have. This is because the Traffic Channels report displays your top marketing channels that drive traffic to your website.
There are eight types of default channels in Google Analytics. Each offering an effective way to gauge the current state of your marketing and figure out the paths visitors are taking to get to your e-commerce site.
The eight default channels are:
Organic Search - Indicates visits from organic (unpaid) search results.
Direct Search - Indicates visits where users navigated directly to the URL or the source of the visit is unknown.
Paid Search - Indicates traffic from PPC campaigns run in search results.
Display - Indicates traffic from display advertising, such as Google AdWords remarketing campaigns
Referral - Indicates traffic where users clicked a link from another site, excluding major search engines.
Social - Indicates visits from social networks (Facebook, Twitter, etc.).
Email - Indicates traffic from links clicked in email messages, whether mass email marketing or individual messages.
(Others) - Indicates traffic from online advertising outside of search and display, such as cost-per-view video advertising.
By gaining an understanding of each channel, you will find that this report will help you explore which marketing channels is best for your business. You can access these in multiple reports, but for a basic Google Analytics reporting setup you can navigate to Acquisition >> All traffic >> Channels.
3. E-Commerce Tracking Report
Now as you may know, with an ecommerce website, maximizing the value for your company requires that a decent amount of your website visitors becomes a client. With Google Analytics e-commerce tracking, you can correlate your sales data with your website data like sessions, bounce rate, landing pages, traffic source and most importantly your e-commerce conversion rate.
To explain why the last one is so important to keep track of, the Google Analytics e-commerce conversion rate is the percentage of sessions with results in e-commerce transactions over any given time period. By increasing your conversion rate you can increase revenue per visitor, acquire more customers, and grow your business. That’s why the conversion rate is such an important metric to monitor and optimize for the long term success of your e-commerce website.
Keep in mind, conversions don't have to be sales but can be any key performance indicator (KPI) that matters for your business. Examples include:
- Buying something on an ecommerce site.
- Becoming a registered user.
- Signing up for a subscription (whether paid or free).
- Downloading trial software, a whitepaper, or some other goodie that presumably will predispose people to progress in the sales funnel.
- Requesting more information about a consulting service or B2B product.
- Upgrading from one level of a service to a higher level.
- Spending a certain amount of time on the site or reading a certain number of articles.
- Returning to the site more than a certain number of times during the measurement period.
Based on the data the Google Analytics e-commerce report provides, you can develop an understanding of which products sell well, how much revenue per transaction, the number of products per transaction and how long (in time and in number of sessions) it takes customers to make the decision to purchase giving you the ability to adapt your marketing tactics based on those results.
4. All Pages Report
This is one of the more important reports to keep an eye on each week. The All Pages report can show you your top content along with the average amount of revenue each page generates. This report helps in determining what content performs best on your website and where you may need to tweak your content.
The data shown for each page gives you an idea of the interaction level of the page. Below are some examples of the data types:
Pageviews: Total number of times the page was viewed.
Unique Pageviews: This de-duplicates page views to show how many sessions contained a view of the page.
Avg. Time on Page: Works out the average time across the pageviews by using the time metrics available for the page..
Entrances: How many times this page was the first page in a session.
Bounce Rate: The percentage of entrances on this page where the user did not interact with the website any further.
% Exit: This is the percentage of pageviews that were the final page in a session.
Page Value: Calculated using goal and ecommerce values by dividing the total value by the number of pageviews for this page.
Now this may seem like a lot of information to collect and process, but like all reports, the data displayed here can be made into a pie or bar chart which can be helpful in displaying the data in an easy to read format. Though pie charts can be hard to display if you have lots of pages. Whatever way works best for you in organizing your data.
5. AdWords Report
This brings us to the AdWords report. Now we all know just how important AdWords ads are creating a successful online marketing campaign. So understanding how these AdWords are performing is crucial in getting the most out of your AdWords ads.
The Google Analytics AdWords reports give you post-click performance metrics for users who have clicked on your AdWords ads and visited your website. This gives you a window into your users Acquisition → Behavior → Conversion cycle. The AdWords report will provide you a window into your users Acquisition, Behavior and Conversion patterns.
You can use the AdWords reports to see what outcomes occurred as a result of users clicking on your AdWords ads. This can include which campaigns have been most effective at driving conversions and generating revenue (AdWords Campaign Report) or even give you an in depth analysis of the effectiveness of each keyword you bid on (AdWords Keywords Reports) as well as when the best time(s) of the day to target your AdWords Campaign (AdWords Hour of day report).
Having this much detailed access to this kind of information allows you to quickly act on and improve your the success of your AdWords Ads. Google judges the success of your AdWords by Quality Score. If you have a high enough score, then you’re more likely to get better ad positions, more impressions, and increased click throughs. Having a higher Quality Scores can also result in lower costs per click, so you can get more traffic for lower prices.
Conclusion
As mentioned earlier, Google Analytics Reports can provide you with a wealth of information regarding your website as well as providing valuable insight into your users and their behaviour. But it can also be an overwhelming amount of information to take in.
The reports mentioned here are by no means the be-all end-all of Analytical reporting. But they should at least provide you with the necessary insights you need to get started on gaining a clear, comprehensive picture of your online business, its users and your websites overall performance.
